Industry.
As of January-October 2025, industrial enterprises in the region produced 715,059.5 million tenge in current prices, with a physical volume index (PVI) of 119.1%.
In the processing industry, which accounts for the largest share of industrial production (86.6%), products worth 619,077.3 million tenge were produced from January to October 2025, with a PVI of 122.2%.
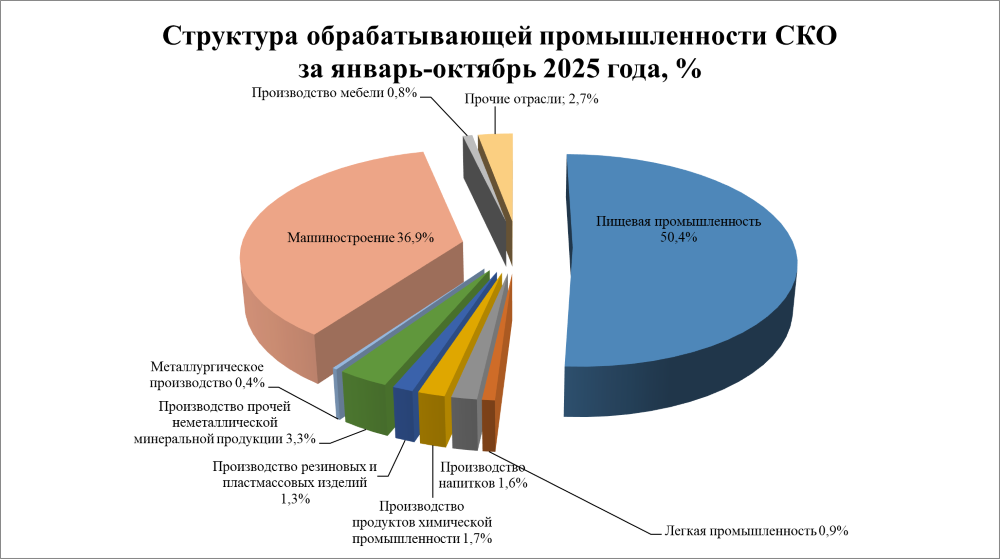
Food production for January-October 2025 reached 312,155.6 million tenge, with vegetable and animal oil production increasing 3.6 times and animal feed production up 47.4%.
In the mechanical engineering sector, accounting for 36.9% of processing industry volume, products and services worth 228,709.6 million tenge were produced, with a PVI of 133.3%.
Electric power, gas, steam, hot water, and air conditioning supply for January-October 2025 totaled 74,353.1 million tenge, with a PVI of 96.6%.
In water supply, waste collection, treatment, and disposal for January-October, production volumes reached 14,579.3 million tenge, with a PVI of 100.2%.
Under the Unified Industrialization Map (since 2022), 25 projects worth 388.8 billion tenge are planned with 3.1 thousand new jobs.
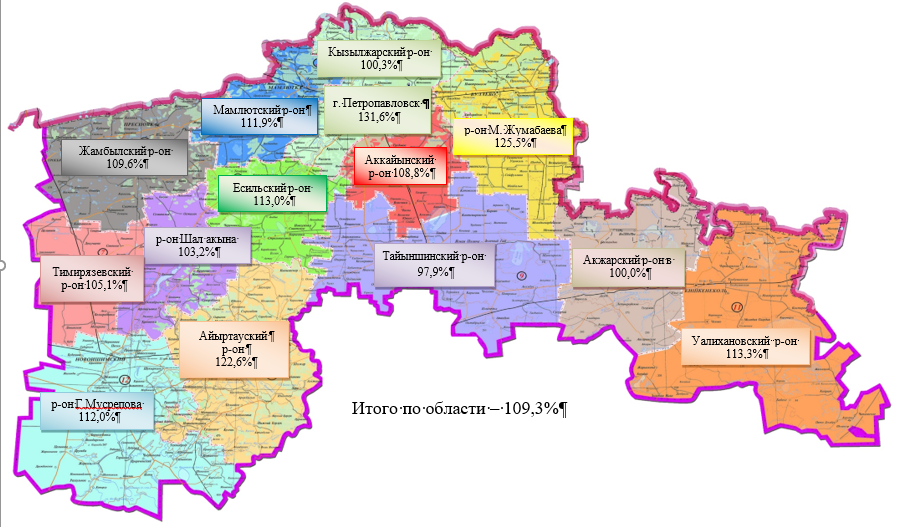
Agriculture. For January-October 2025, gross agricultural output totaled 878,326.8 million tenge with a PVI of 109.3% compared to January-October 2024.
Meat production (live weight) reached 68.5 thousand tons or 112.2% of January-October 2024 levels;
Milk – 334.9 thousand tons (102.5%);
Eggs – 530 million units (105.1%).
Livestock population as of November 1, 2025 across all farm categories:
Cattle – 270.2 thousand heads (99.8%);
including cows – 143.4 thousand heads (98.8%);
Sheep – 359.6 thousand heads (104.1%);
Goats – 7.0 thousand heads (94.3%);
Horses – 128.8 thousand heads (105.2%);
Pigs – 144.5 thousand heads (112.5%);
Poultry – 3,593.5 thousand heads (108.8%).
Entrepreneurship.
As of November 1, 2025, the number of active small and medium business entities operating in the region was 36.0 thousand units.
Foreign Trade Turnover. According to preliminary data, the region's foreign trade turnover (excluding mutual trade) for January-September 2025 was $564.2 million USD, up 40.3% compared to the same period in 2024, including exports of $315.3 million USD (increase of 59.6%) and imports of $248.9 million USD (growth of 21.7%).
Main export partners are China (24.8% of total exports), Uzbekistan (13.7%), Afghanistan (11.7%), Tajikistan (9.9%), Iran, Islamic Republic (8.9%).
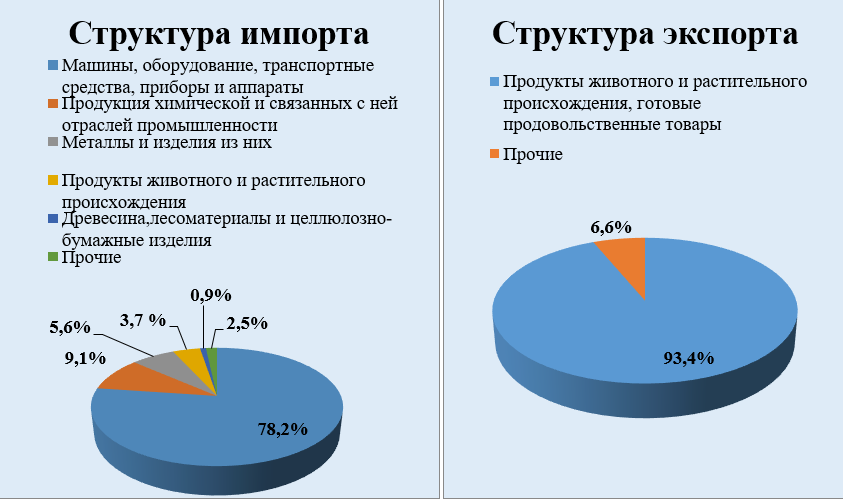
The largest share of exports comprises: "Animal and vegetable products, prepared foodstuffs" - 93.4% of total exports or $294.4 million USD (growth of 72.0% compared to January-September 2024).
Leading import suppliers are Germany (45.7% of total imports), China (20.5%), Hungary (8.3%), Turkey (3.2%), Poland (2.7%).
Import structure is dominated by: "Machinery, equipment, vehicles, instruments" (78.2% of total imports or $194.7 million USD), "Chemical industry products" (9.1% or $22.6 million USD), "Metals and metal products" (5.6% or $13.8 million USD), "Animal and vegetable products, foodstuffs" (3.7% or $9.1 million USD), "Wood and paper products" (0.9% or $2.3 million USD), "Mineral products" (0.8% or $2.0 million USD).
Mutual trade volume with Eurasian Economic Union member states for January-September 2025 was $417.5 million USD, down 16.6% from the same 2024 period, including: exports of $48.0 million USD (decrease of 46.8%), imports of $369.5 million USD (decrease of 9.9%).
Capital Investments.
Capital investment volume for January-October 2025 reached 418,824.0 million tenge or 107.3% of the same 2024 period.
Investment financing sources include enterprise and private funds (35.4% of total), state budget (25.6%), bank credits (5.5%), and other borrowed funds (33.5%).
Priority investment sectors are transport and warehousing (29.9%), agriculture, forestry and fishing (26.5%), industry (24.4%), and real estate operations (10.4%).
Housing Construction. For January-October 2025, 194,351 square meters of residential space was completed, representing 103.9% of the same 2024 period.
Water Supply. Under the Housing and Communal Infrastructure Development Concept for 2023-2029, allocations for 2025 include:
Subsidizing drinking water service costs from critical group and local water systems: 5,400.3 million tenge.
Social and engineering infrastructure development in rural settlements under "Auyl-El besigi" water supply program: 784.5 million tenge from regional budget.
Water network recovery (current repairs): 522.6 million tenge.
Installation and purchase of integrated water treatment modules in 65 villages: 520.6 million tenge.
Social Protection. Registered unemployed for January-October 2025 numbered 4,382 people, 4.4% lower than the comparable 2024 period. Registered unemployment represented 1.6% of economically active population.
As of November 1, 2025, employment assistance was provided to 20,492 people with 10,406 new permanent jobs created. 2,498 people engaged in public works.
Targeted social assistance as of November 1, 2025 was provided to 3,712 citizens totaling 337.6 million tenge.
Healthcare. Approved annual healthcare budget was 58 billion 195.6 million tenge. For the reporting period through November 1, 2025, planned expenditure was 33 billion 565.6 million tenge with 33 billion 292.1 million tenge (99.2%) spent, including:
Capital repairs of healthcare facilities: 2 billion 772.2 million tenge annual plan (MB – 2 billion 722.2 million tenge), reporting period plan 2 billion 105 million tenge (MB – 2 billion 105 million tenge), spent 2 billion 105 million tenge (MB – 2 billion 105 million tenge);
Infrastructure strengthening: 6 billion 163.8 million tenge annual plan (MB – 6 billion 163.8 million tenge), reporting period plan 2 billion 791.2 million tenge (MB – 2 billion 791.2 million tenge), spent 2 billion 791.2 million tenge (MB – 2 billion 791.2 million tenge);
Healthcare facility construction and reconstruction for 2025: 144.4 million tenge total.
From local budget 144.4 million tenge, including:
Design and estimate documentation development for "Polyclinic construction (250 visits/shift) in Beskol village" – 37.1 million tenge. Reported period plan 5.0 million tenge, spent 5.0 million tenge (100%);
Design documentation for "Regional emergency medical station (100,000 calls/year) with simulation center in Petropavlovsk" - 35.7 million tenge. Reported period plan 35.7 million tenge, spent 35.7 million tenge (100%).
Medical clinic construction in Karakoga village – 26.2 million tenge.
Medical clinic construction in Vozviyshenka village – 39.4 million tenge.
Polyclinic construction (250 visits/shift) in Kishkenekel village – 6.0 million tenge.
Education. The 2025 education budget allocation is 161,179.8 million tenge.
For the reporting period through November 1, 2025, planned expenditure was 135,607.2 million tenge with 135,446.5 million tenge (99.9%) spent.
Educational facility development for 2025 totaled 242.5 million tenge, including:
From local budget – 242.5 million tenge.
Boarding school construction (300 places) in Petropavlovsk – 146.9 million tenge. Reported period plan 109.1 million tenge, spent 100%.
School design documentation (600 students) in Novoishminskoye village – 5.0 million tenge. Reported period plan 5.0 million tenge, spent 100%.
School design documentation (120 places) in Beloe village – 23.4 million tenge. Reported period plan 17.3 million tenge, spent 100%.
School design documentation (400 students) in Karagoga village – 42.1 million tenge. Reported period plan 15.0 million tenge, spent 100%.
Kindergarten design adjustment (280 places) in Petropavlovsk – 25.0 million tenge. Reported period plan 24.9 million tenge, spent 100%.
Educational facility capital expenditures totaled 7,442.0 million tenge. Reported period plan 6,938.8 million tenge with 6,933.4 million tenge (99.9%) spent.
| Number of Schools | 458 | 444 | 96.9% |
|---|
Appendix
| Indicators | Unit | 2023 | 2024 | Jan-Oct 2025 | % to 2024 |
|---|---|---|---|---|---|
| Meat (live weight) | thousand tons | 77.6 | 74.3 | 68.5 | 112.2 |
| Milk | thousand tons | 348.9 | 370.7 | 334.9 | 102.5 |
| Eggs | million units | 567.9 | 602.7 | 530 | 105.1 |
Physical Volume Index of Industrial Products by Districts for January-October 2025

Physical Volume Index of Agricultural Output by Districts for January-October 2025